


How to watch up to 8 instruments at once with multi-chart trading on Exness Terminal

Watching several markets doesn’t have to mean switching between dozens of tabs or constantly changing charts.
Whether you're comparing multiple instruments, tracking related markets, or analyzing different timeframes, multi-chart trading on Exness Terminal lets you view up to eight charts in a single workspace.
In this article, we'll explain how multi-chart trading works, how to set it up in Exness Terminal, and how to use it for different trading approaches.
What is multi-chart trading on Exness Terminal?
Multi-chart trading lets you view and organize several charts on one screen, making it easier to analyze markets the way you prefer.
Each chart can be customized independently to match the way you trade. For example, you can:
- Monitor correlated markets side by side.
- Compare the same instrument across multiple timeframes.
- Use different chart types.
- Apply specific technical indicators to each chart.
Make better decisions, easier
Save layouts, use templates, or chart seamlessly using 100+ indicators and 50 drawing tools.
How to set up multi-chart trading in Exness Terminal
Setting up multiple charts in Exness Terminal only takes a few steps:
- Click the Layout setup icon near the top-right of the terminal.
- Choose your preferred layout with up to eight charts.
- Select an instrument for each chart, then adjust the timeframes, chart types, and indicators as needed.
- Once everything is set up, click Save to keep your chart layout, including indicators, for future trading sessions.

Tip: If you want to use the same settings across all charts, you can sync selected elements, like the symbol, timeframe, crosshair, time, and date range.
- Click the Layout setup icon.
- Under Sync in layout, toggle on the settings you want to sync.
You can experiment with different layouts on a demo account to find a setup that suits your trading style.
What you can do with multi-chart trading in Exness Terminal
There’s no single “best” way to use multi-chart trading. How you organize your charts depends on the markets you follow and the type of analysis you want to perform.
Here are a few ways you can use the features in Exness Terminal.
Compare correlated markets
Viewing related markets side by side can make it easier to compare how their prices move over the same period. This can be useful when you're monitoring instruments that tend to move together.
Monitor multiple timeframes
Display the same instrument across multiple timeframes to view short-term price action alongside the broader market trend.
Track several markets
Keep multiple instruments visible at once instead of switching between individual charts.

Save different setups
Create and save chart arrangements for separate trading routines, so they're ready whenever you need them. For example, you might save one setup for short-term analysis and another for higher-timeframe market views.
How different traders use multi-chart trading
The multi-chart layout can be adapted to different trading styles, making it useful for a wide range of traders.
Trading style | Example | Usage |
Scalpers | EURUSD, GBPUSD, XAUUSD, and US100 | Monitor multiple instruments or timeframes to react quickly. |
News traders | XAUUSD, US500, EURUSD, and USDJPY | Watch several markets during major economic events. |
Correlation traders | EURUSD and USDCHF | Compare correlated instruments side by side to see where their price movements align or diverge. |
Multi-timeframe traders | EURUSD (M15, H1, H4, and D1) | Analyze the same instrument across different timeframes simultaneously. |
Active intraday traders | Up to eight frequently traded instruments | Keep frequently traded markets visible throughout the trading days. |
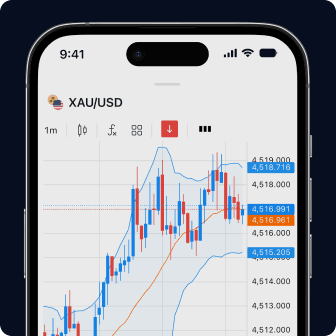
Every tool you need, all in one place
Chart, trade, and manage your funds—all from one user-friendly screen.
Multi-chart trading as part of Exness Terminal
Multi-chart trading works alongside the other tools available in Exness Terminal. Without leaving your browser, you can access TradingView-powered charts, technical indicators, drawing tools, watchlists and place trades from the same trading platform.
Together, these tools let you analyze markets and manage trades seamlessly in a single workspace.
Key takeaways
- Display up to eight charts simultaneously in Exness Terminal.
- Customize each chart with individual instruments, timeframes, chart types, and indicators.
- Save and reuse different chart setups for specific trading routines.
- Use multi-chart trading to compare markets, monitor multiple timeframes, or follow multiple instruments at once.
- Try a range of layouts on an Exness demo account before trading live.
FAQs
1. Does Exness Terminal support multi-chart trading?
Exness Terminal supports multi-chart trading, allowing you to display up to eight charts at the same time on the web-based trading platform.
To open multiple charts, click the Layout setup icon in the top-right corner of Exness Terminal and choose your preferred layout. You can then assign an instrument to each chart and customize the timeframe, chart type, and technical indicators.
Since each chart has its own settings, you can compare different instruments side by side or view the same instrument across multiple timeframes without affecting the other charts.
2. Can I save different chart layouts?
You can save multiple chart layouts, including your selected instruments and indicators. This makes it easy to switch between different market conditions, trading styles, or analysis without having to set everything up again.
3. Can I synchronize multiple charts?
Exness Terminal lets you synchronize the symbol, timeframe, crosshair, time, and date range across charts in the same layout. Other chart settings remain independent, so you can customize each chart separately.
4. Can each chart have different indicators?
Each chart can have its own technical indicators, chart type, timeframe, and instrument. This lets you tailor every chart to a different type of market analysis.
5. Can I use different instruments and timeframes on each chart?
Each chart can display a specific instrument and timeframe. You can monitor multiple markets at the same time or compare the same instrument across various timeframes.
6. Is multi-chart trading available on mobile?
Multi-chart trading is currently available on Exness Terminal, the web-based trading platform. While the Exness Trade app supports trading on mobile devices, the multi-chart features are designed for the web.
7. Can Exness be linked to TradingView?
You can use TradingView's charts, tools, and indicators directly within the Exness Terminal without needing a separate TradingView account.
This article does not constitute investment advice. Past performance is not indicative of future results. The information, data, prices, and market conditions presented in this article are accurate as of the publication date and may change over time. Your capital is at risk. Please trade responsibly.